Mapping is done in ArcGIS software and is based on a combination of orthorectified aerial photographs from the Norwegian Polar Institute (NP), a 20m resolution Digital Elevation Model, also from NP, and field observations and multiple photos from around the Isfjorden coastline. Digitising was done in approximately 1:3000 scale for the data capturing with the aim of producing a dataset of a quality of 1: 30 000 scale (which was the original outline in the project proposal) or better over the whole area, with a slightly higher precision in the shoreline region. Limitations to aerial photographs and the precision of interpretation and digitising for most areas results in a precision of 3-5 m for single points and 5-15 meters for easily visible borders between sediment types. Where there are gradual sediment transitions and/or difficulties due to aerial photograph quality or in very steep or shadowy areas, the precision and quality can be lower than this. Since the method has been tested and developed during the project, we expect a continued development and quality in future data acquisition relating to the Svalcoast Science Hub maps.
We have followed the Norwegian SOSI classification system for Quaternary geological maps used by NGU (the Geological Survey of Norway) for classification of sediment types, line and point features in surface sediment/Quaternary geology maps. Where necessary, additional codes to capture the variation in Svalbard soft sediments have been developed and used. The standardised classification and visualisation system allow for direct comparison between the DynaCoast geodata and surface sediment maps used in planning and environmental protection on mainland Norway.


Map example 1: Longyearbyen/Adventfjorden area
Scale 1:15 000
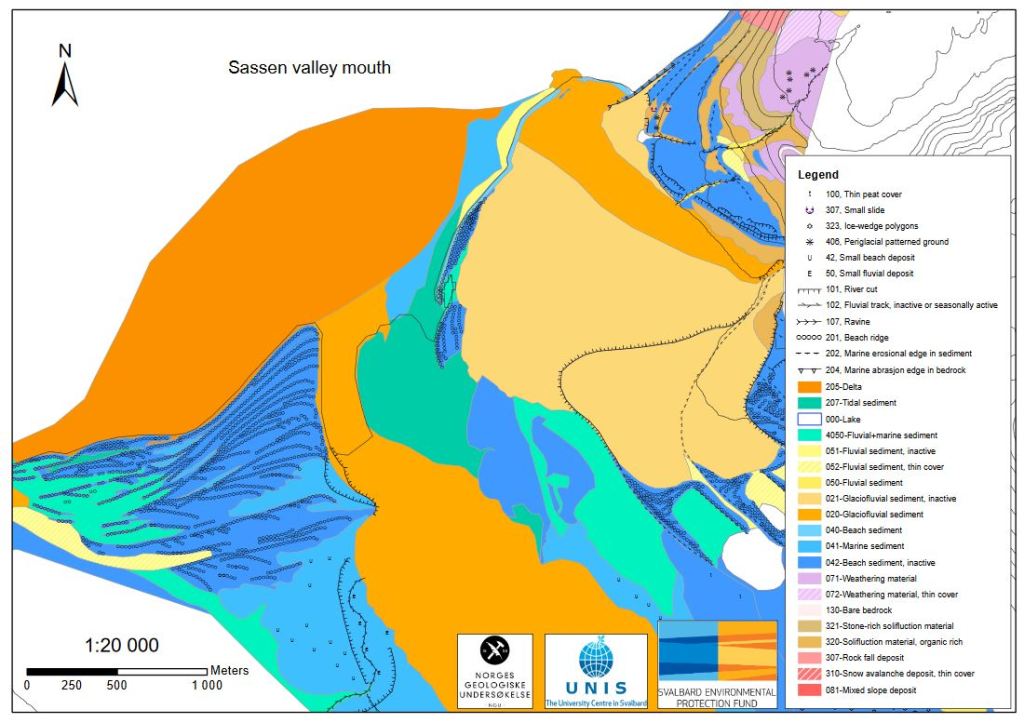
Map example 2: Sassen valley mouth (Sassendalen)
Scale 1:20 000
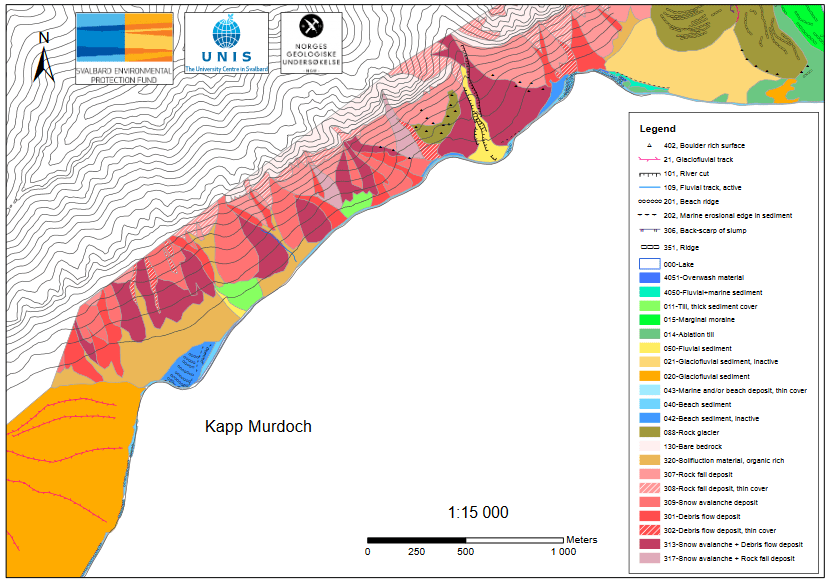
Map example 3: Kapp Murdoch (North coast of Sassen Fjord)
Scale 1:15 000
Map example 4: Colesbay
Scale 1:15 000
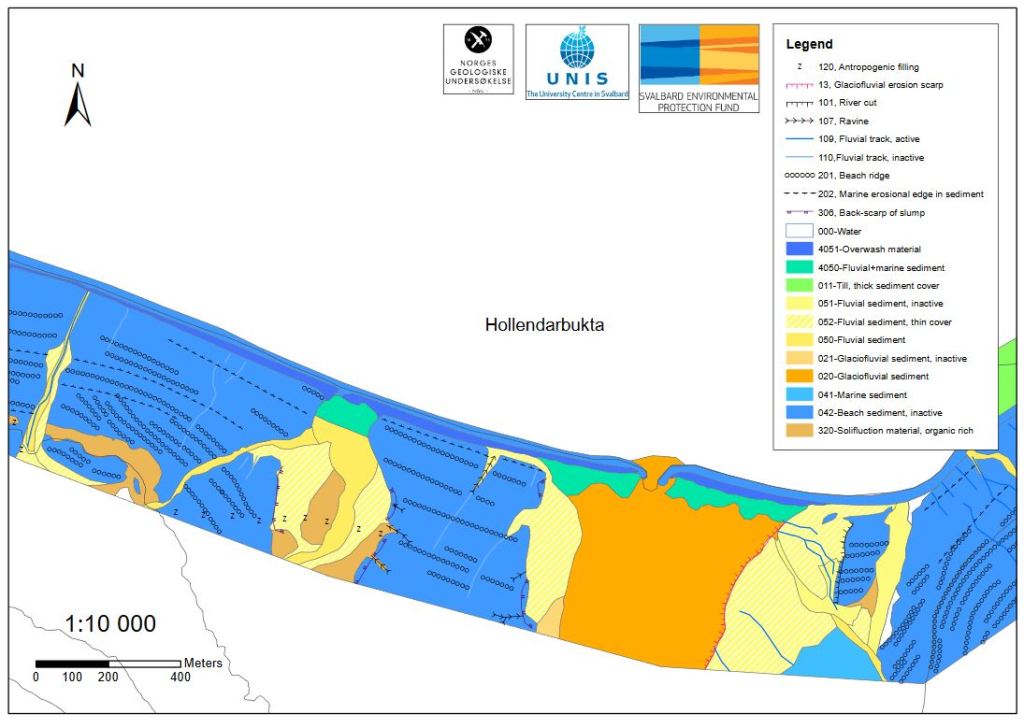
Map example 5: Hollendarbay
Scale 1:10 000
